
Energy monitoring in Home Assistant - with or without power meters
I finally set aside some time over the holidays to build an energy monitoring dashboard in Home Assistant (HA). Long on my todo list, I never gave it much more than a cursory thought. With only two power monitoring devices before picking up a few Shelly 1PM relays in November, the effort never seemed worth the time. To my dismay as I have since realized, this was wrong.
Power monitors shine when used to measure the power draw on devices that vary their electrical usage. Computers and washing machines fall into this category. For devices that use power at a near constant rate, like lights and TV’s, power monitors don’t really add much value. Here, energy consumption can simply be computed (at least theoretically) based on the time a device is in use and its rated wattage (Watts x Time). That’s it. So for my dashboard, I could have had some of this data, with or without a power meter, long ago.
Real-time usage and consumption on a daily and monthly basis were a few of the data points I was looking to put on a dashboard. As with any reporting/monitoring function, once you decide what you want, you have to figure out how you are going to get it. Some of this will come will come from my power meters and some of it I will need to manually provide. Home Assistant handles both these cases with ease, demonstrating again, it awesomeness as a home automation/integration platform. :-)
What follows then, is a brief “how-to” to setup energy monitoring in Home Assistant, with or without power meters.
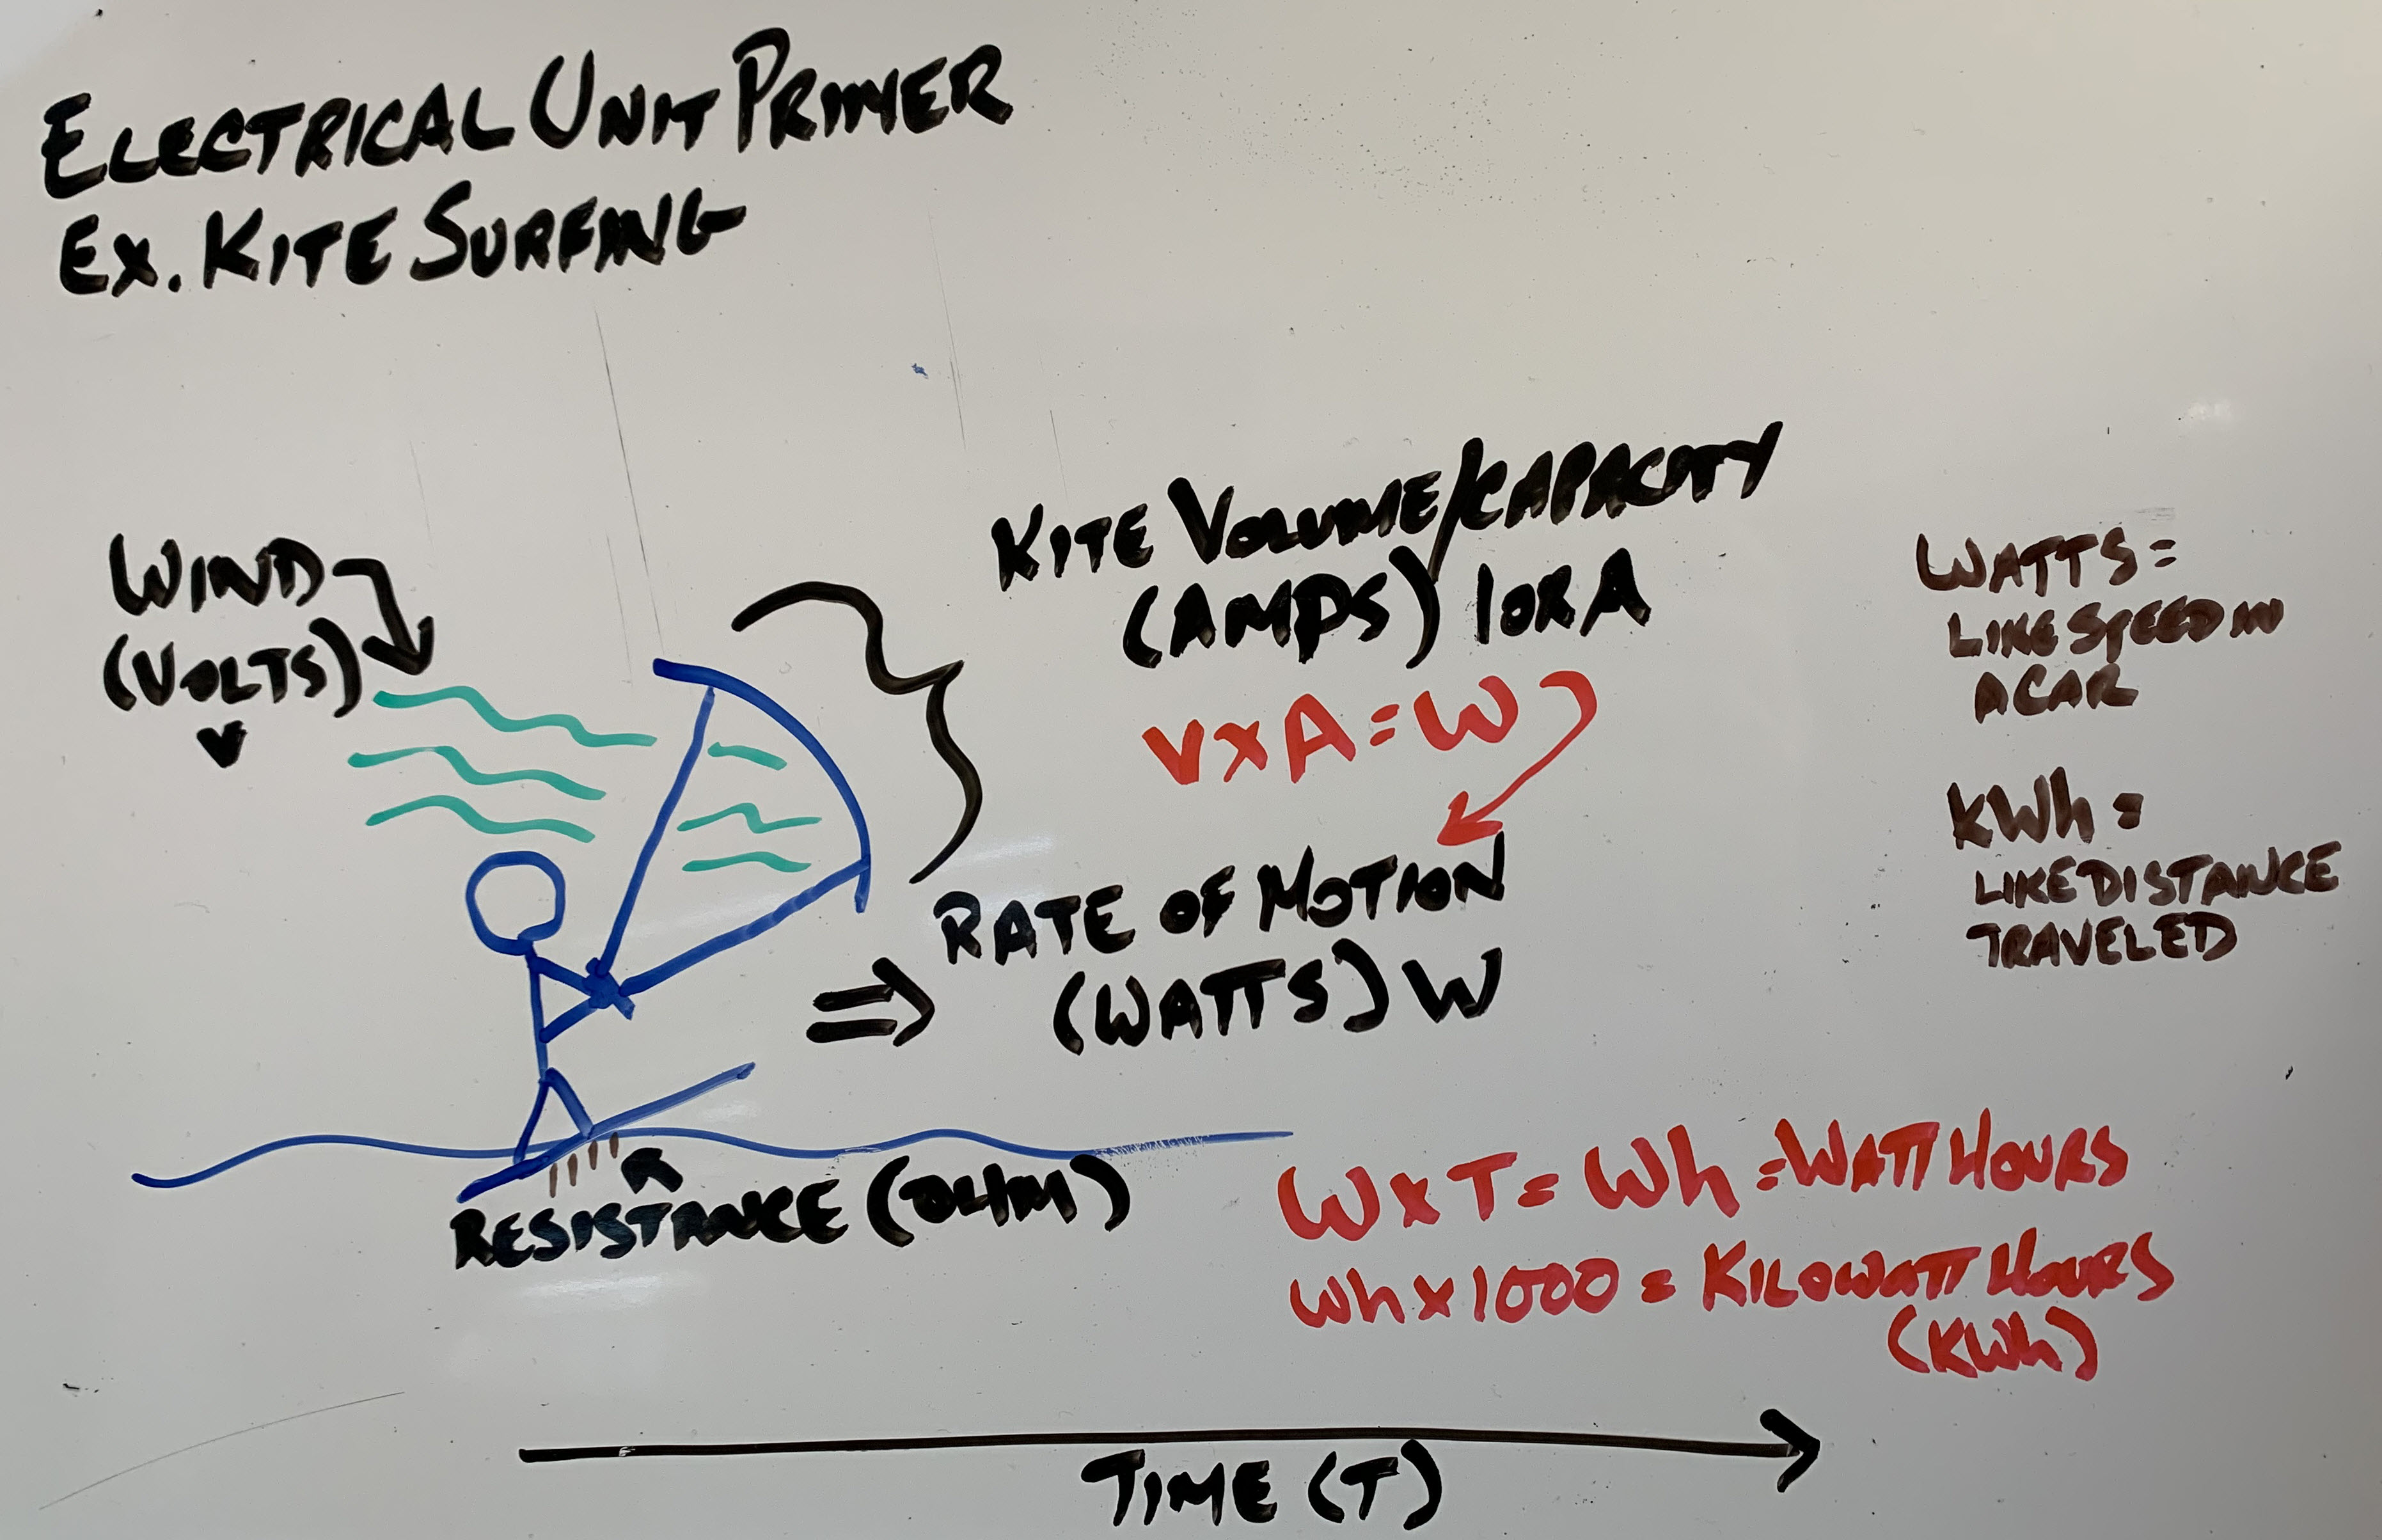
Advisory: this post gets into electrical units like Watts and Kilowatt hours (kWh), in case you are feeling a little fuzzy on those topics here’s my super helpful infograpic…
To get started, it makes sense to walk through a simple example. I’ll focus on the process first, then provide code examples with useful links in the section that follows.
The Process
We’re going to track and compute the energy consumption of a fictional lamp on my desk. The lamp has a 10 Watt light bulb and is plugged into a smart plug that is integrated into Home Assistant. This means two things:
- The lamp, via the plug, will show as an entity in HA named
switch.desk_lamp(…or whatever name is assigned to it) - Because of #1, HA also knows when the lamp is turned on/off. (see state machine)
We’ll have to provide the power info since the smart plug does not provide it.
Step 1:
To tell Home Assistant the lamp is using energy at the rate of 10W when it is on and 0W when it is off, we’ll use HA’s templating platform to create a new sensor entity called sensor.desk_lamp_power.
Step 2:
A second entity needs to be created to accrue the Watts used over time. If our 10W lamp was on for 10 hours then it will have consumed 100Wh (10W x 10h) or .1kWh (100Wh/1000) in that time period (Note: your monthly utility bill usually uses kWh for electricity units).
While the math looks simple in principle, it begins to get a little messy once you consider the lamp may be toggled any number of times and the duration of each On event will need to be properly captured. Fortunately, HA provides a built-in process to perform the running calculation. The awkwardly named “integration” integration (that’s not a mistake, it’s actually a Riemann sum integral) is used to create this second entity. If we name this new entity desk_lamp_energy the integration will create sensor.desk_lamp_energy and use the previouly created sensor.desk_lamp_power as an input.
Step 3:
Step 2 is an intermediary sensor. It keeps accruing the energy used over time but it doesn’t separate out the values on a daily or monthly basis, which is what I really want. With some effort I could define a process to calculate these values, but it is simpler to let HA handle this by using the Utility Meter integration. Since I am interested in daily and monthly values (there are other periods available) this will produce two more sensors: sensor.desk_lamp_daily_energy and sensor.desk_lamp_monthly_energy.
That’s it for creating new sensor entities. If you followed the process above you end with the switch entity and four sensors below:
switch.desk_lampsensor.desk_lamp_powersensor.desk_lamp_energysensor.desk_lamp_daily_energysensor.desk_lamp_monthly_energy
If you are using an energy monitoring device it may create some of these entities for you. For example, my Shelly 1PM devices auto created (via the Shelly integration) the sensor.xxxx_power and sensor.xxxx_energy entities. My Sonoff power meter only created sensor.xxxx_power and my UPS did none. It only provided the power draw as a percent of the total so I had to manually create sensor.ups_power to convert the value into watts.
YMMV.
Code Examples:
The code in all of these examples will need to be placed in Home Assistant’s configuration.yaml file or a sub file if you have split the configuration.
Step 1
If you’ve never used templating in Home Assistant before or want a handy link for more detail, here’s the pertinent information.
Example to create sensor.desk_lamp_power using a power level of 10W when powered on *:
sensor
	- platform: template
		sensors:
			desk_lamp_power:
				friendly_name: "Desk Lamp Power"
				unit_of_measurement: 'W'
				value_template: >
					{% if is_state('switch.desk_lamp', 'on') %}
						10
					{% else %}
						0
					{% endif %}
* In this context, the 10W represents the rate of usage, similar in concept to the miles per hour number used for vehicles in motion. An actual 10Wh (watt-hours) of energy would be consumed after 1 hour of constant usage at that power level.
Alternative:
Some of my lights are attached to dimmer switches. At full power they would be using 100% of the light’s wattage and below that, some percentage of the max power level. Here’s the code to self-adjust that calculation based off the light’s brightness level.
sensor
	- platform: template
		sensors:
			office_couch_light_power:
				friendly_name: "Office Couch Light Power"
				unit_of_measurement: 'W'
				value_template: >
					{% if is_state('light.office_couch_light', 'on') %}
						{% set brightness = states.light.office_couch_light.attributes.brightness | int  %}
						{{ 18 * (brightness | float / 255) | round(2) }}
					{% else %}
						0
					{% endif %}
Step2
This is an intermediary step using the power level from the prior step as an input to compute the actual energy used over time. Manually calculating this would be tricky so the quickest/easiest method is to let HA perform the calculation using this integration based on a Riemann sum integral. Because this is a continous calculation step three is needed to retrieve values for specific time periods.
sensor
	- platform: integration
	  source: sensor.desk_lamp_power
	  name: desk_lamp_energy
	  unit_prefix: k
	  round: 2
Bonus: if you are curious about the math used in this calculation, its namesake, and feel like venturing into a rabbit hole, here’s a few extra links to get lost in…
Step3
This step uses the Utility Meter integration in Home Assistant and creates the sensors that will return the actual energy used (in kWh) for the time periods you specify. Since I’ve used daily and monthly time periods in my examples above, the script to create those sensors is below. This will need to reference the sensor created from Step two.
utility_meter:
  desk_lamp_daily_energy:
    source: sensor.desk_lamp_energy
    cycle: daily
  desk_lamp_monthly_energy:
    source: sensor.desk_lamp_energy
	cycle: monthly
Dashboard:
With the setup complete, we can now create a dashboard to view the data from the sensors we’ve created. For my dashboard, I wanted to see power levels (ex. sensor.desk_lamp_power), and the daily & monthly totals for energy consumed (ex. sensor.desk_lamp_daily_energy & sensor.desk_lamp_daily_energy).
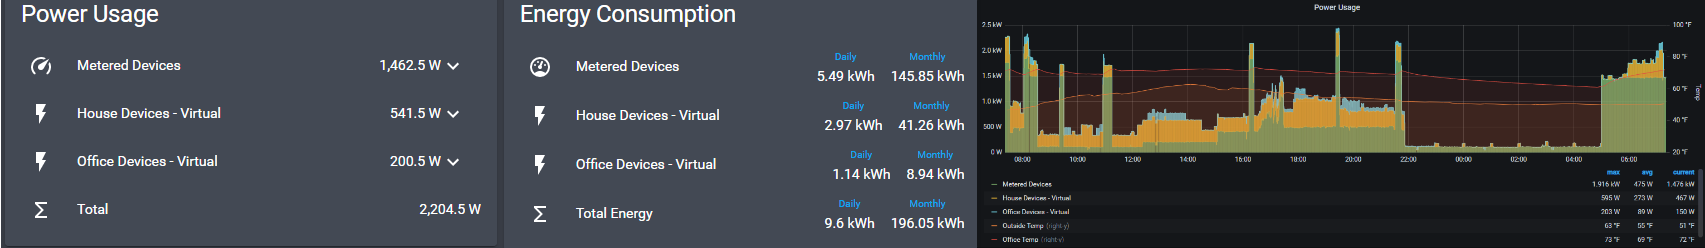
Here’s a capture from my initial dashboard (larger img):
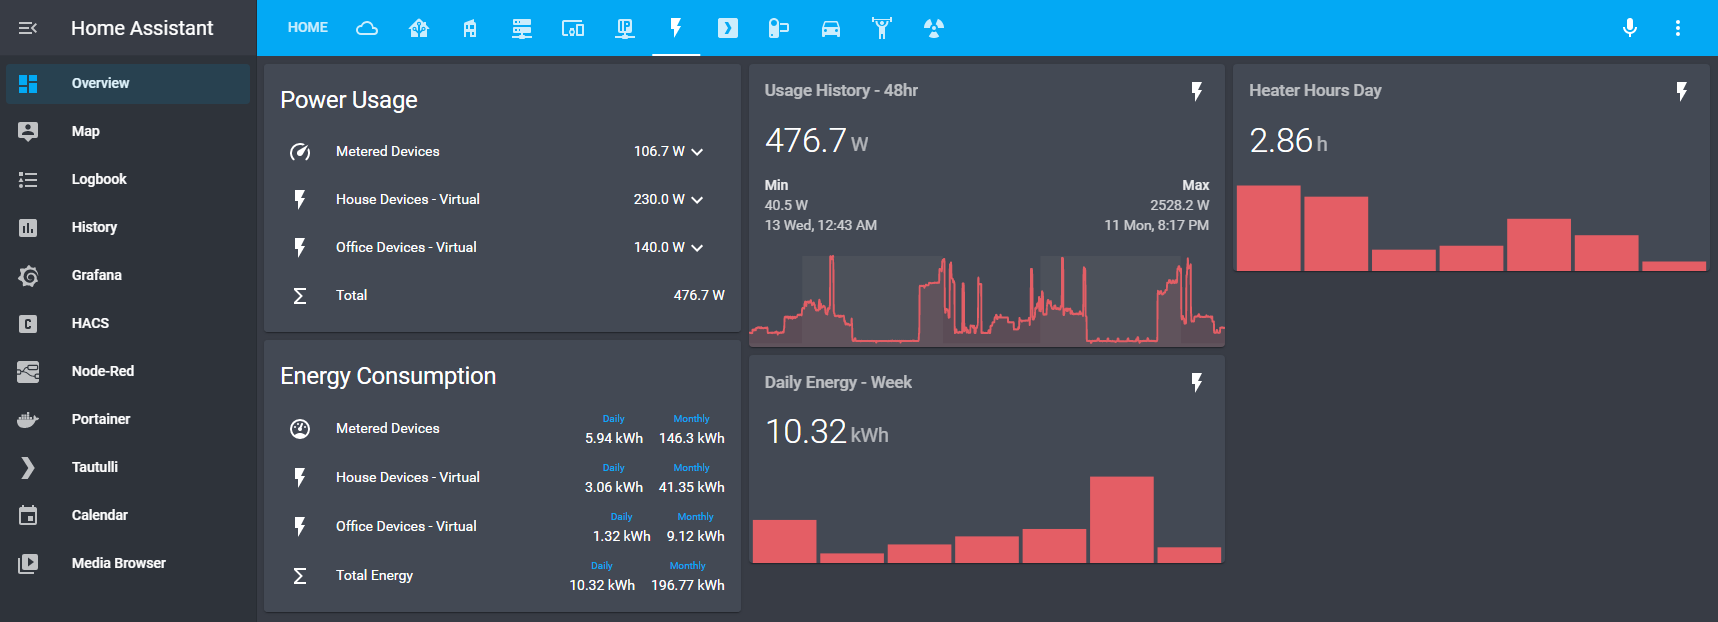
You’ll notice I grouped the devices by metered - those attached to an energy monitor or by virtual - those computed based on wattage value. A subtotal is displayed for each grouping which can also be expanded to show the individual devices.
The templating platform is used to created the subtotal entities. Here is a sample:
sensor
	- platform: template
	sensors:
		metered_devices_power:
		friendly_name: "Metered Devices"
		unit_of_measurement: 'W'
		icon_template: mdi:speedometer
		value_template: "{{ (states('sensor.family_room_couch_light_power') | float +
							states('sensor.ups_power') | float +
							states('sensor.workbench_light_power') | float +
							states('sensor.office_heater_power') | float +
							states('sensor.office_computers_power') | float +
							states('sensor.sonoff_washing_machine_power') | float) | round(2) }}"
The following HACS add-ons were also used for the UI:
If interested, here’s a template using the add-ons above in my initial dashboard
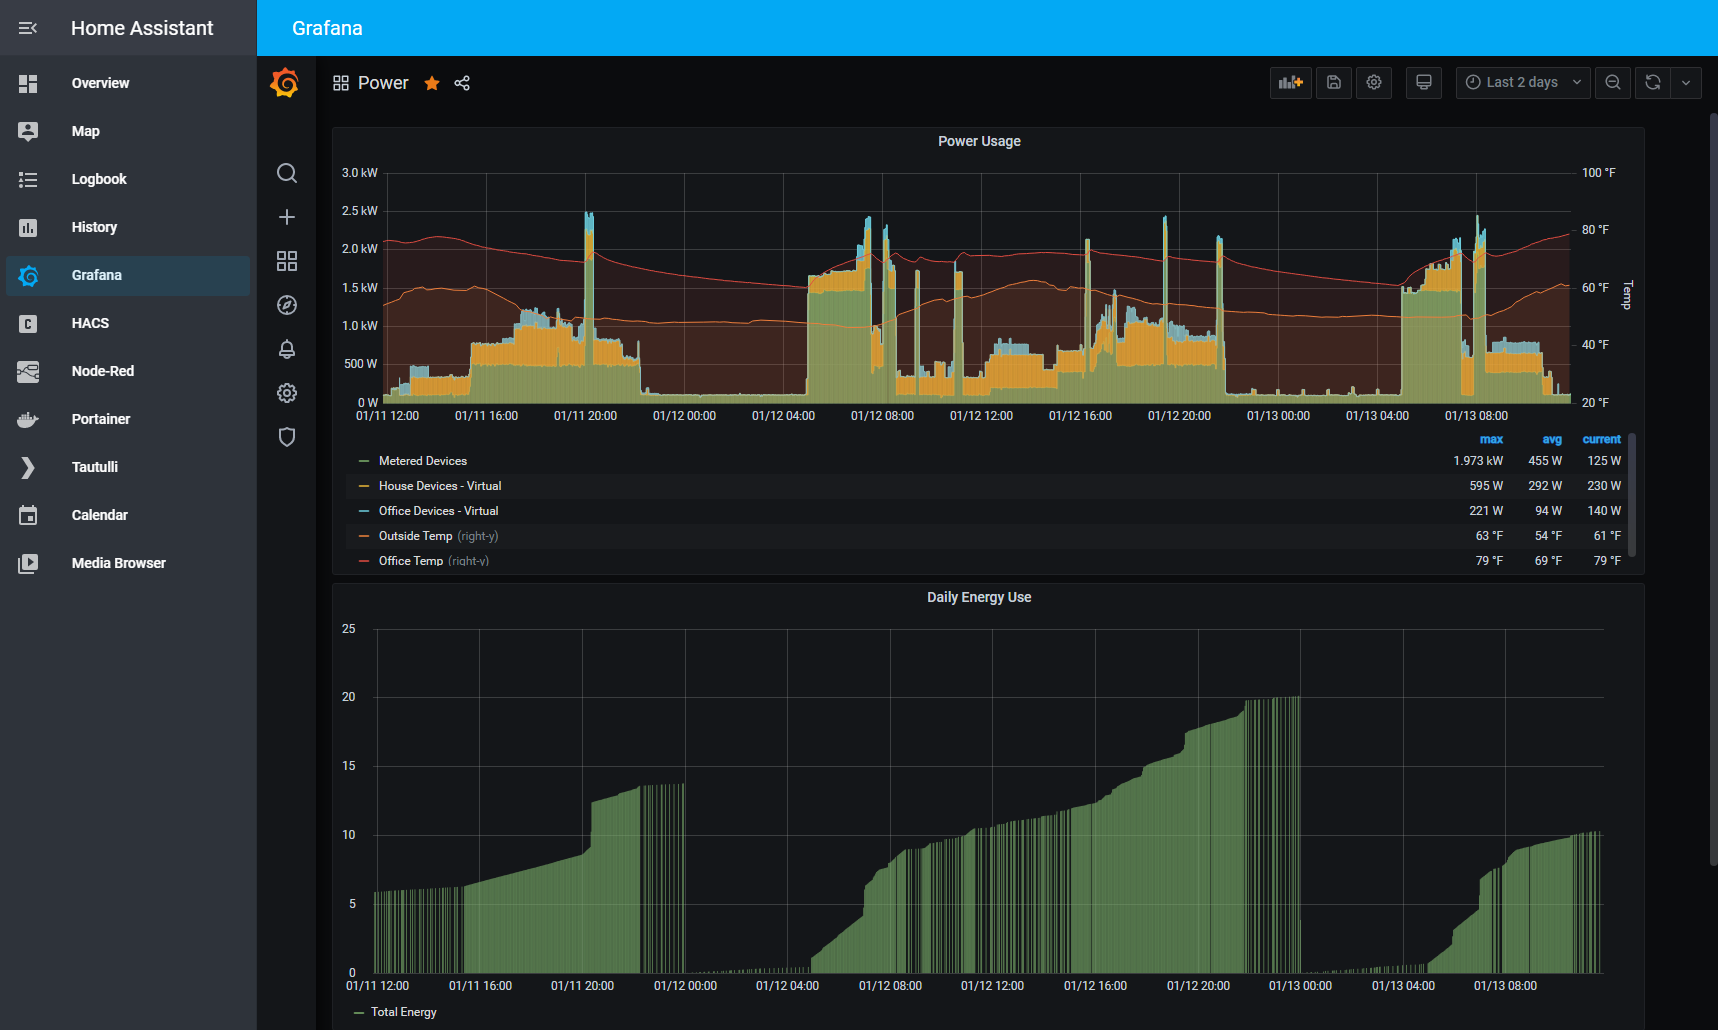
Finally, though this isn’t specific to HA, if I want to dig deeper into the data, all of the energy sensors that were created in the process outlined above flow directly into Influxdb which I can then view in Grafana. For example, if I want to view how heater usage affects the temperature in my office I can view the graph below (the spikes correlate to when the space heater is in use). I can view this separately in Grafana but I’ve also included access to it in the navigation bar in Home Assistant.
Next Steps:
I’m not capturing 100% of our usage yet. Things like the dryer, kitchen appliances, and other wall outlets are still offline from an HA viewpoint. To reach 100% I could put a monitoring device in my home’s main panel or even stream the data directly from my utility’s meter and find the difference between that data and the data I already collect. Eventually I’ll probably get there. Near term however, I am more likely to put a few more Shelly devices behind wall outlets, like I did here, to caputure transitory usage, like charging laptops or other mobile devices.
Related posts
Automation ideas for Home Assistant
Was this post helpful?
 or drop me a note in the comments. Thanks.
