
Traefik: Observing metrics with InfluxDB and Grafana ...plus log file management
Traefik’s dashboard is useful to detect routing issues, but if you want to see any metrics you’ll need to use an external monitoring tool. When I posted my guide to understanding Traefik’s configuration last summer, outputting metrics to InfluxDB and Grafana was my intended next step. I didn’t quite finish that sequence then, though I did setup log file output at the time for a related monitoring function. After recently discovering one of those logs had grown to be over 9gb, I took that as a cue it was time to pick up where I left off.
This post then is broken into two parts:
- Setting up Traefik metrics
- Creating a process to manage log files
Note: the following parts assume you already have Traefik, InfluxDB, and Grafana instances running in Docker
Part I: Setting up Traefik metrics
As I indicated above, I am connecting Traefik to InfluxDB. Traefik also supports metric connections for three other backends: Datadog, Prometheus, and StatD. You can find out more here if interested.
Step 1 - Configure Traefik to output to InfluxDB
Update traefik.yml with the yaml below
metrics:
  influxDB:
    address: 192.168.2.112:8089
    protocol: udp
    addEntryPointsLabels: true
    addServicesLabels: true
    pushInterval: 60s
UDP is the default protocol Traefik uses but HTTP can be used instead if that is desired. I opted to stick with UDP because it has less overhead. Details on the available settings are here. Be sure to update the IP address with your own.
Step 2 - Configure InfluxDB to accept UDP connections from Traefik
The syntax in these examples are for docker compose. If you are managing via CLI this link here may be up some help. These changes are for your InfluxDB entries in docker compose.
Under ports, add port 8089 entry for UDP
ports:
  - "8086:8086" #existing port setting
  - "8089:8089/udp" #new port setting for UDP used by Traefik
Under environment, add entries to enable UDP. Note: I had an existing database in InfluxDB named home_assistant. I decided to use that instead of creating a new one.
environment:
  - ... #pre-existing entries here, added new lines below
  - INFLUXDB_UDP_ENABLED=true
  - INFLUXDB_UDP_DATABASE=home_assistant
Restart both containers and data should now be flowing from Traefik to InfluxDB.
Step 3 - Grafana - add data source and create new dashboard
Add a new data source in Grafana. This provides Grafana with access to Traefik’s data in InfluxDB. Select the gear icon on Grafana’s left navigation bar, choose Data Sources, Add data source, then select InfluxDB. The remaining inputs on the page involve adding connection details like server address, database name, and login credentials. More info can be found here.
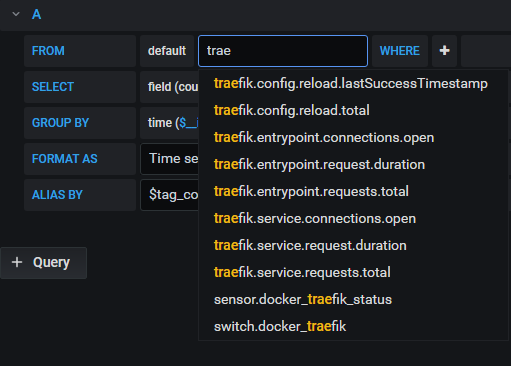
Once the data source has been added and you are back on the main screen, Select the compass icon (it reads Explore) on the left navigation bar, and then begin typing Traefik in the select measurement field. This should display a list of available metric points.
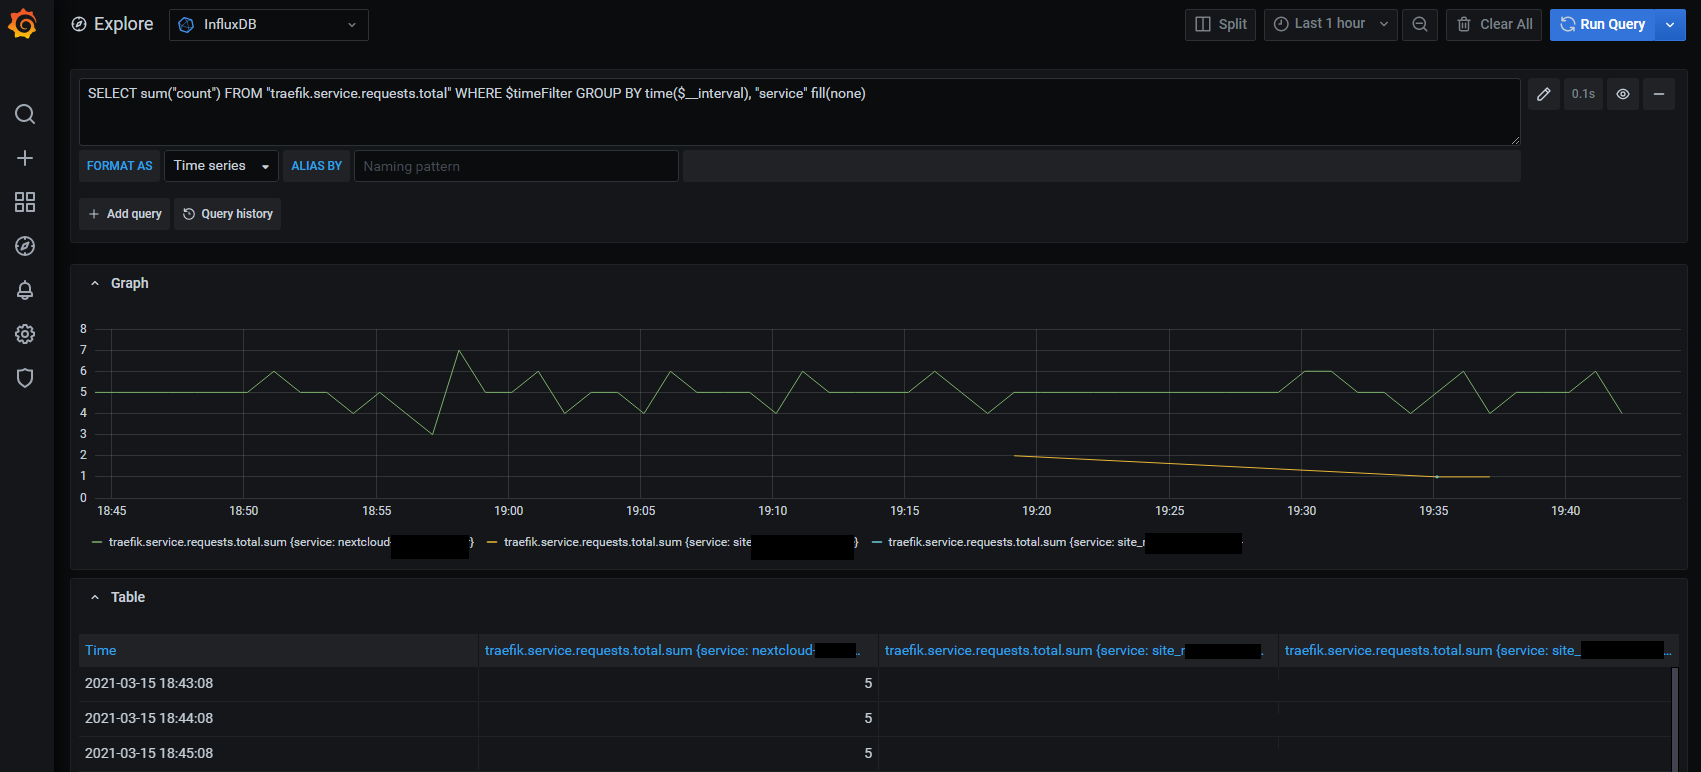
If you want to test, select the pencil icon on the right side of the screen and paste the query below. Then select Run Query.
SELECT sum("count") FROM "traefik.service.requests.total" WHERE $timeFilter GROUP BY time($__interval), "service" fill(none)
The result should be a graph similar the one below:
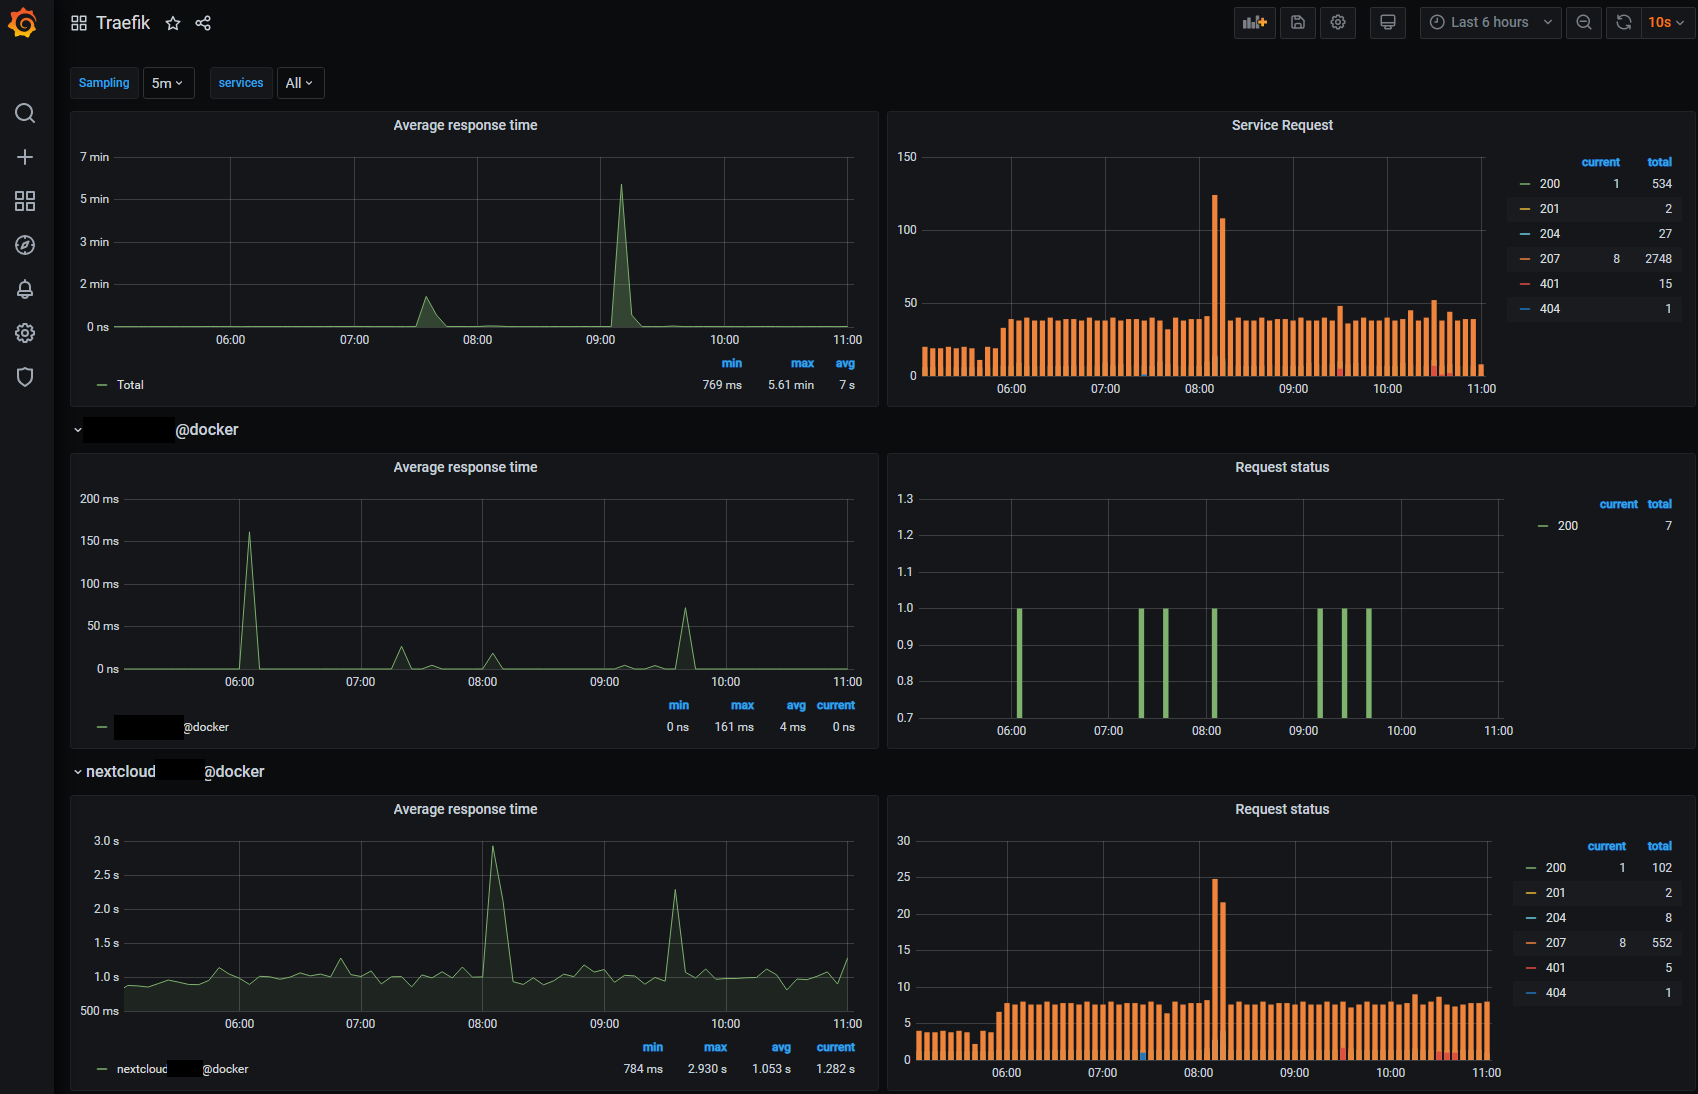
From here, you’re free to create any dashboard that suits your needs. If you are unsur where to start, have a look at Grafana’s community provided dashboards. I found Traefik v2 on this page (filtered by traefik/influxdb, so be sure to scroll down) to be a good base. It separates response data for each container proxied by Traefik (example below).
If you want more, change the filters on the above referenced page to use Prometheus as the data source. The dashboards results won’t be importable, but they contain many more examples if you are looking for inpsiration.
Part II: Controlling log file size
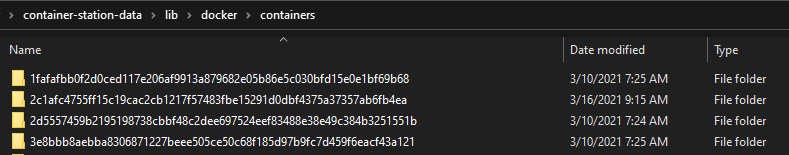
I should start by saying this section is really only relevant if you manually adjust Traefik’s log file output. By default, Traefik writes logs to the stdout stream which Docker then captures and manages in JSON formatted files. Docker actually does this for all your containers and stores the data in the .../lib/docker/containers/ directory. Each container (in my case 17) has its own randomly named folder in that directory so one of the obvious challenges is identifying which folder belongs to Traefik.
There are good reasons why Traefik and Docker each do what they do. This guide is a good breakdown of Docker’s process. This also represents a level of abstraction I initially choose to sidestep. Instead, I opted to output Traefik’s logs to the persistant storage outside Docker. The problem with this approach is that the log file size will increase indefinitely unless you have another process setup to manage it. I didn’t, hence my 9gb log file.
I could have reverted to Traefik’s default, but I wanted to keep the logs where they were, so a different solution was needed. My host machine (QNAP NAS) uses a custom Linux distro that include logrotate (which I was hoping to use) so I set about looking for dockerized versions. There are a few available.
I ended up using the blacklabelops/logrotate repo. While it doesn’t appear to be maintained any longer, I’m not exactly asking it to do anything fancy …just rotate the logs. It has 30M+ pulls so it’s probably good enough for my needs.
It took some trial and error, but I eventually got it working with the settings below:
  log_rotate:
    container_name: log_rotate
    image: blacklabelops/logrotate
    environment:
      - LOGS_DIRECTORIES=${CONTAINERPATH}/traefik/log /etc/traefik/log/
      - LOGROTATE_OLDDIR=/etc/traefik/log/archive
      - LOGROTATE_INTERVAL=daily
    #  - LOGROTATE_INTERVAL=hourly
    #  - LOGROTATE_SIZE=100M
      - LOGROTATE_COPIES=10
      - TZ=${TZ}
    volumes:
      - ${CONTAINERPATH}/traefik:/etc/traefik
If someone in DevOps happens to read this I am sure they could easily rattle off a few better alternatives. Docker can be configured to perform logrotate, but it would have required me to getting into the weeds yet again. “Not today!” I said. So who knows, maybe I’ll be back updating this in a few months…
References: